This article describes how you can create a chart to display the configured parameters on a day-wide representation.
Solution
1) To create a new chart go to Webadmin -> Security & Monitoring -> Charts and click "Add Chart" the button.
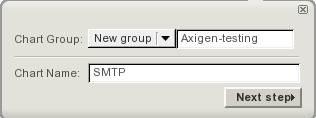
2) In the Chart creation window create, if required, a new chart group or if you already have a defined chart group you can select it from the related drop-down box. This will assign the new chart to the specified group. Enter a suggestive chart name and click the "Next Step" button
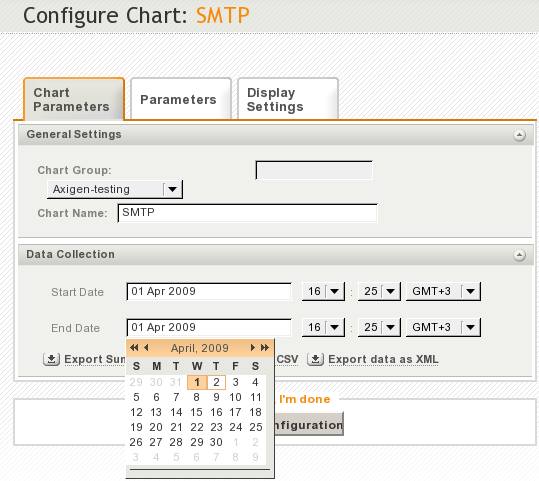
3) You will be directed in the Configure chart window. In the "Data Collection" section you will find the "Start Date" and "End Date" configured with the same value, by default the current date on the server. To configure the chart to represent the parameters data for a day, starting with the current date, simply modify the "End Date", by clicking on the date field, and selecting from the calendar the next day. If you are required to represent the data for another time period, modify the start and end date accordingly. Click the "Save configuration" button at the bottom of the page.
4) Go to the "Parameters" tab and click on the "Add Chart Counter" button. Enter a "Parameter ID" which will represent the parameter displayed name on the chart view. Choose from the drop down box related to the "Parameter to collect" option, the desired parameter to display on the chart. In our example this will be "SMTP Inbound Connection". For the "Chart Group" option select "Server", as we are interested, in our example, of all the incoming SMTP connections for the server. From the drop-down box related to the "Aggregation Function" select the required option. In our example we selected "maximum", as this will return the highest value for each aggregation display interval, thus indicating the maximum load on the SMTP Receiving service in a period of time. Remember to click the "Save Configuration" button in order to save the modifications.
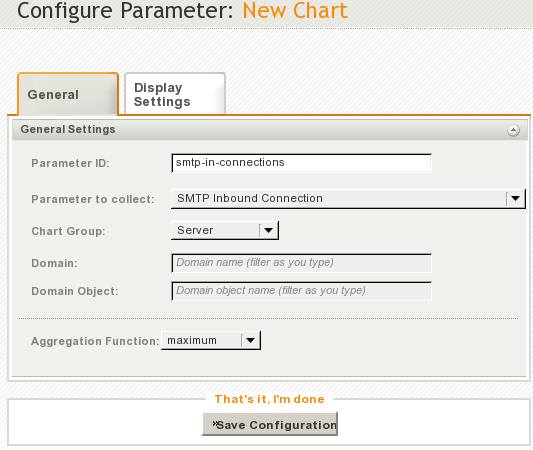
NOTE: Via the "Display Settings" tab of the above depicted "Configure Parameter" window, you can set a custom display color schema for the configured parameter. This is most helpful when you are displaying more parameters on the same Chart. To add additional chart counters, redo step 4 for each of the required parameters.
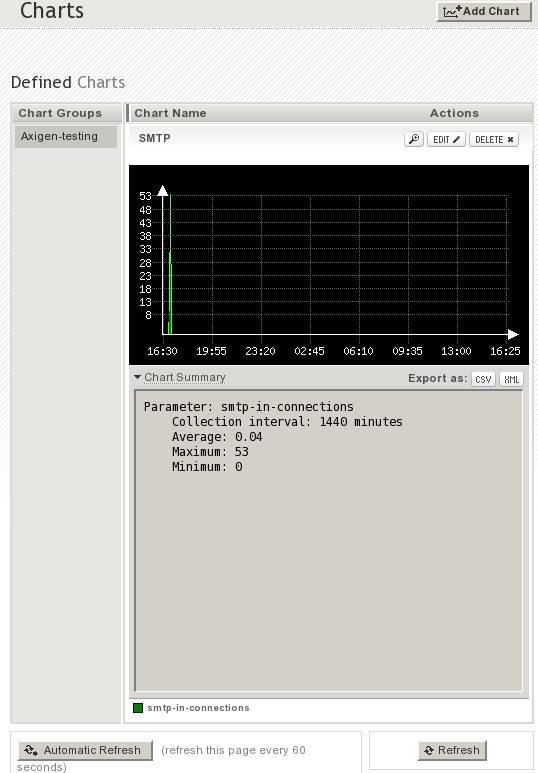
5) To display the chart at any time, simply go to Webadmin -> Security & Monitoring -> Charts -> select the group from the "Chart Groups" list and navigate to the desired chart.
In the Chart display section you have three buttons in the upper-right side. The first one, from left to right, is a magnifier for the respective chart, which allows you to view an enlarged version of the chart. The next one is the edit button, that will give you access to the chart configuration, described in the above steps and the last button will allow you to delete the respective chart.
Below the chart display you can find the "Chart summary" link, which gives you access to a list of the configured chart parameters and the collection interval, average, maximum and minimum values for each of them.
Also next to the "Export as" option you can click the desired button (CSV or XML) to export the chart data in the required format.
2) In the Chart creation window create, if required, a new chart group or if you already have a defined chart group you can select it from the related drop-down box. This will assign the new chart to the specified group. Enter a suggestive chart name and click the "Next Step" button
3) You will be directed in the Configure chart window. In the "Data Collection" section you will find the "Start Date" and "End Date" configured with the same value, by default the current date on the server. To configure the chart to represent the parameters data for a day, starting with the current date, simply modify the "End Date", by clicking on the date field, and selecting from the calendar the next day. If you are required to represent the data for another time period, modify the start and end date accordingly. Click the "Save configuration" button at the bottom of the page.
4) Go to the "Parameters" tab and click on the "Add Chart Counter" button. Enter a "Parameter ID" which will represent the parameter displayed name on the chart view. Choose from the drop down box related to the "Parameter to collect" option, the desired parameter to display on the chart. In our example this will be "SMTP Inbound Connection". For the "Chart Group" option select "Server", as we are interested, in our example, of all the incoming SMTP connections for the server. From the drop-down box related to the "Aggregation Function" select the required option. In our example we selected "maximum", as this will return the highest value for each aggregation display interval, thus indicating the maximum load on the SMTP Receiving service in a period of time. Remember to click the "Save Configuration" button in order to save the modifications.
NOTE: Via the "Display Settings" tab of the above depicted "Configure Parameter" window, you can set a custom display color schema for the configured parameter. This is most helpful when you are displaying more parameters on the same Chart. To add additional chart counters, redo step 4 for each of the required parameters.
5) To display the chart at any time, simply go to Webadmin -> Security & Monitoring -> Charts -> select the group from the "Chart Groups" list and navigate to the desired chart.
In the Chart display section you have three buttons in the upper-right side. The first one, from left to right, is a magnifier for the respective chart, which allows you to view an enlarged version of the chart. The next one is the edit button, that will give you access to the chart configuration, described in the above steps and the last button will allow you to delete the respective chart.
Below the chart display you can find the "Chart summary" link, which gives you access to a list of the configured chart parameters and the collection interval, average, maximum and minimum values for each of them.
Also next to the "Export as" option you can click the desired button (CSV or XML) to export the chart data in the required format.
OS:
LinuxWindowsFreeBSDNetBSDOpenBSDSolaris
Distros:
WindowsDEB based distros amd64FreeBSD 7.x