Updated: April 9, 2024
After guiding you through funneling Axigen logs into Elasticsearch with Fluent Bit, we’re now ready to bring Kibana into the setup. This guide walks you through integrating Kibana with Elasticsearch to simplify your interaction with Axigen logs, making them easier to manage and analyze.

Here’s the step-by-step integration guide:
Note: This article is applicable for both RPM based distributions (we’ve used Rocky Linux 9.1) and DEB based distributions (we’ve used Ubuntu 23.04).
Step 1: Preparation
Ensure Elasticsearch and Kibana are on the same network for seamless interaction. Download the latest installation packages for Elasticsearch and Kibana.
- RPM
wget https://artifacts.elastic.co/downloads/kibana/kibana-8.13.0-x86_64.rpm
- DEB
wget https://artifacts.elastic.co/downloads/kibana/kibana-8.13.0-amd64.deb
Step 2: Install Elasticsearch and Kibana
To install both Elasticsearch and Kibana on your system, run:
- yum install (RPM)
yum install ./kibana-8.13.0-x86_64.rpm
or
- apt install (DEB)
apt install ./kibana-8.13.0-amd64.deb
Note: Make sure to note the Elasticsearch password that's generated at this stage, as you’ll need it later on.
Step 3: Configure Elasticsearch
3.1. Enable and start the Elasticsearch service and check that it's operational.
systemctl start elasticsearch.service
3.2. Test the setup by accessing https://<IP_address>:9200.
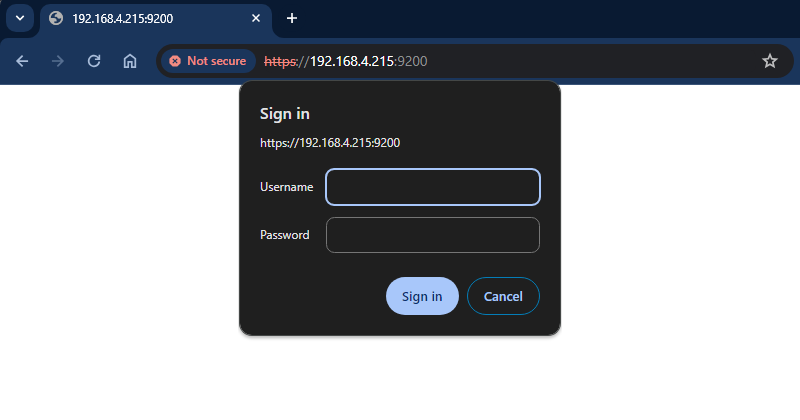
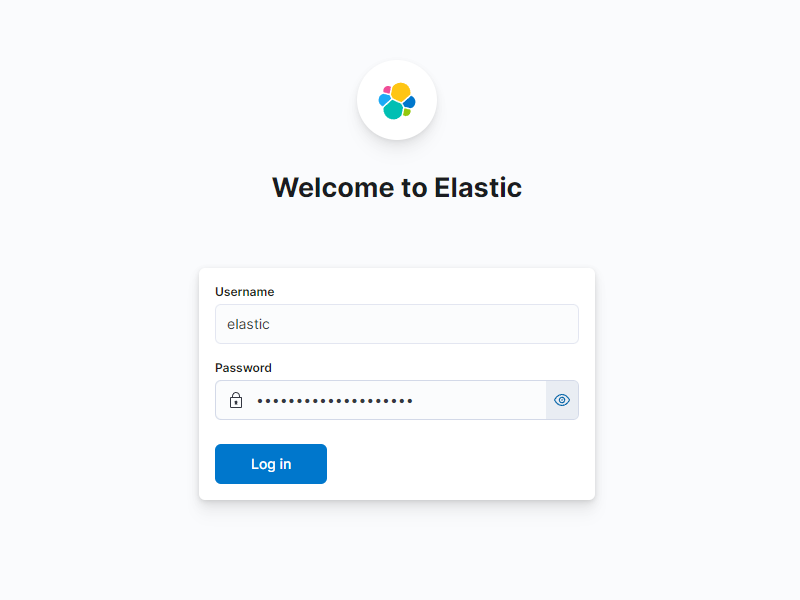
3.3. Log in with the elastic username and the provided password.
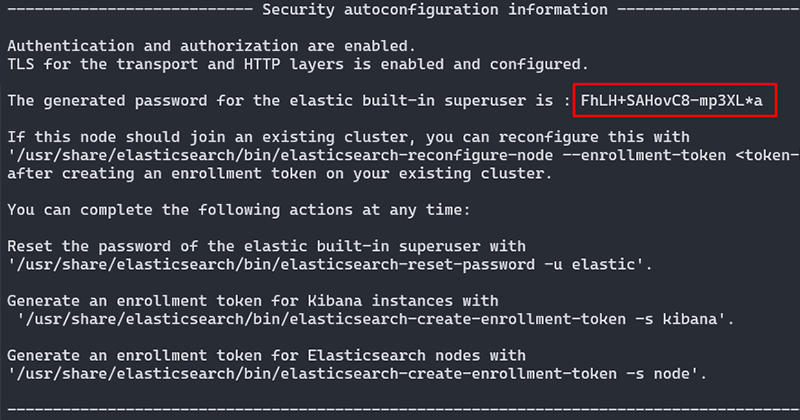
Note: If you've lost the password, you can reset it with /usr/share/elasticsearch/bin/elasticsearch-reset-password -u elastic.
3.4. “You know, for search”
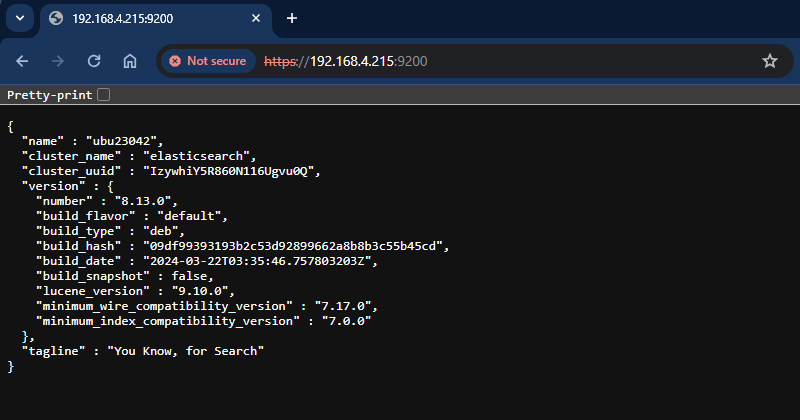
This means Elasticsearch is now is ready to use.
Step 4: Configure Kibana
4.1. Modify Kibana’s settings in the /etc/kibana/kibana.yml file to set up the correct port and IP address — see lines #6 and #11 in our case below.
# https://www.elastic.co/guide/index.html
# =================== System: Kibana Server ===================
# Kibana is served by a back end server. This setting specifies the port to use.
server.port: 5601
# Specifies the address to which the Kibana server will bind. IP addresses and host names are both valid values.
# The default is 'localhost', which usually means remote machines will not be able to connect.
# To allow connections from remote users, set this parameter to a non-loopback address.
server.host: "0.0.0.0"
4.2. Enable and start Kibana and make sure it’s functioning properly.
systemctl start kibana.service
It may take around 1 minute for Kibana to start — you can check its status using:
4.3. Access Kibana’s setup page at http://<IP_address>:5601 and complete the configuration, verifying that the Elasticsearch IP address is correctly listed.
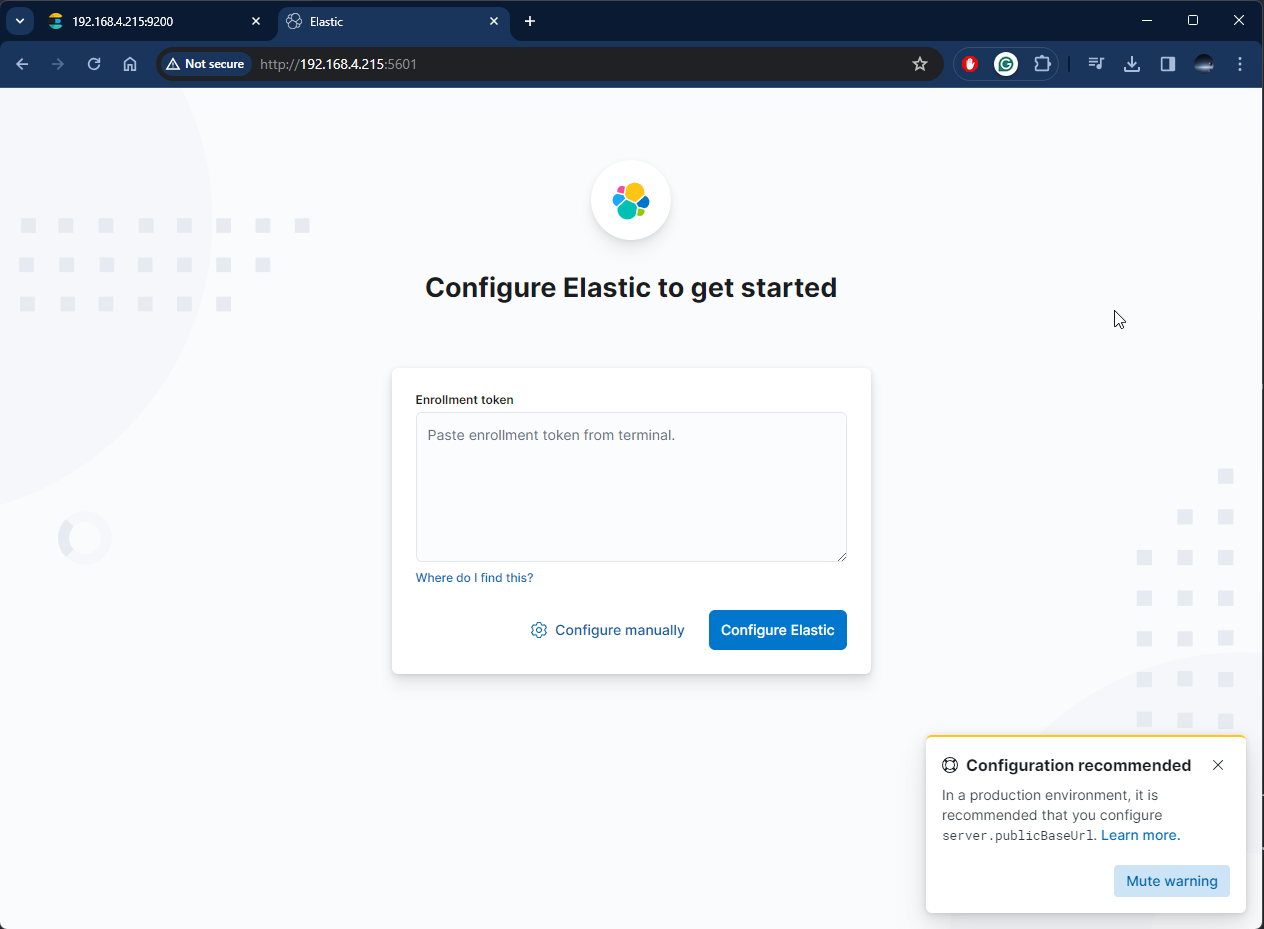
The enrollment token can be generated using the following command:
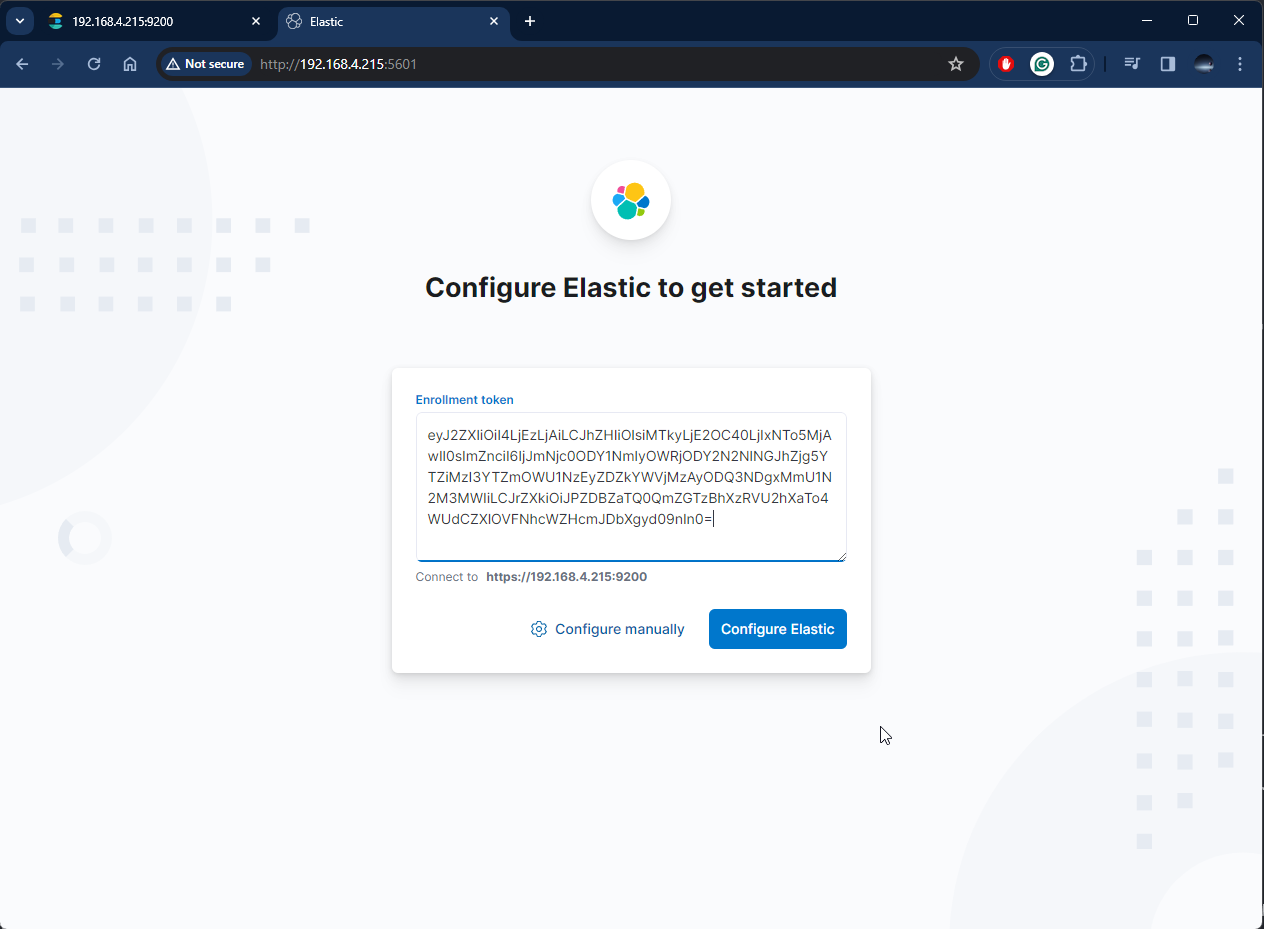
If the IP address is on a different machine, you have to specify the IP address in the /etc/kibana/kibana.yml file. See the last line from the snippet below.
# The URLs of the Elasticsearch instances to use for all your queries.
# elasticsearch.hosts: ["http://localhost: 9200"]
After the enrolment token has been configured, you will be prompted to enter the verification code which can be retrieved using:
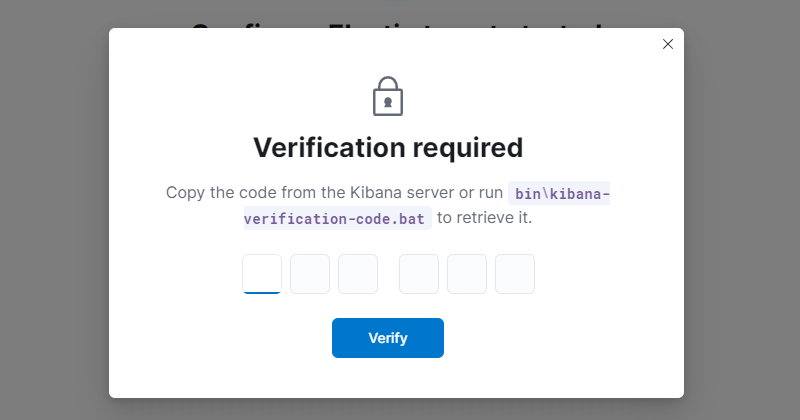
The username and the password are the ones used for the Elasticsearch login.
Step 5: Search Logs in Kibana
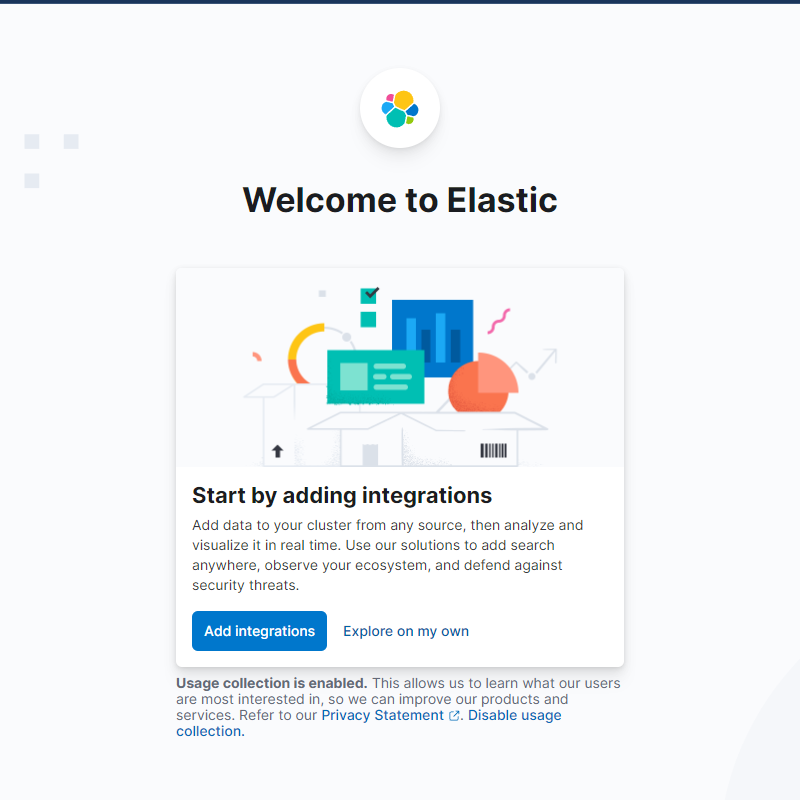
Now that Kibana and Elasticsearch are integrated, add the Elasticsearch integration within Kibana.
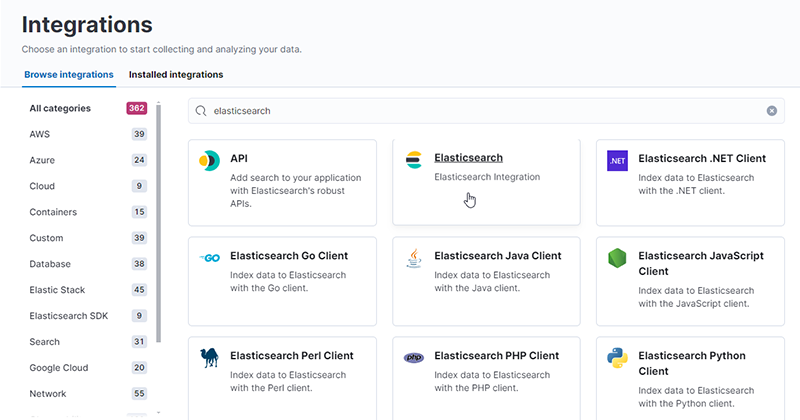
By default, there is no integration installed, and the Elasticsearch integration must be added, so let’s do that by clicking on the Add integration button.
Search for “elasticsearch”…
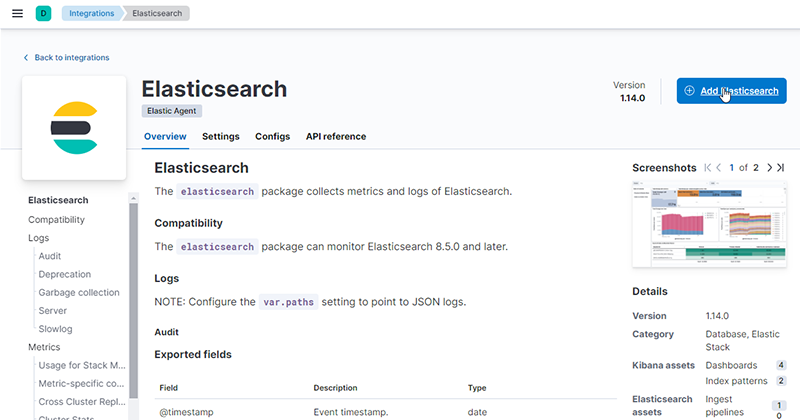
…and add the integration.
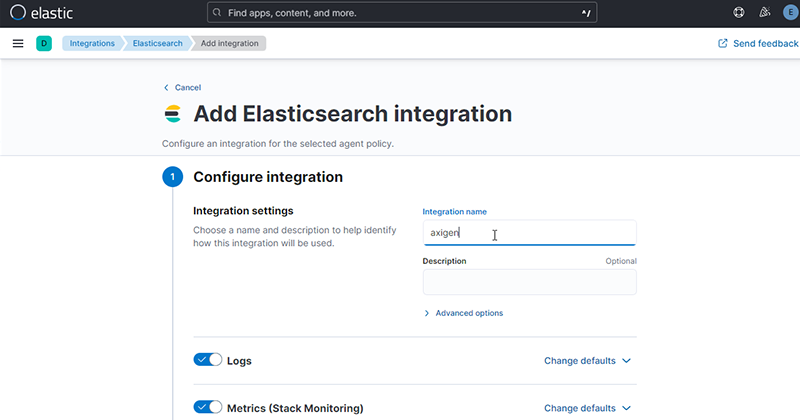
Let’s name it axigen
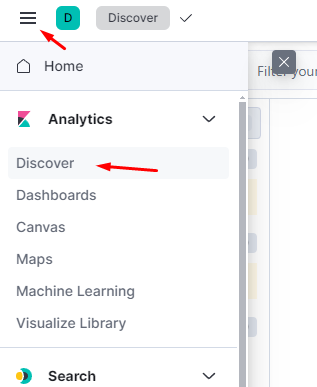
To see some logs, go to the Burger menu in the top-left corner:
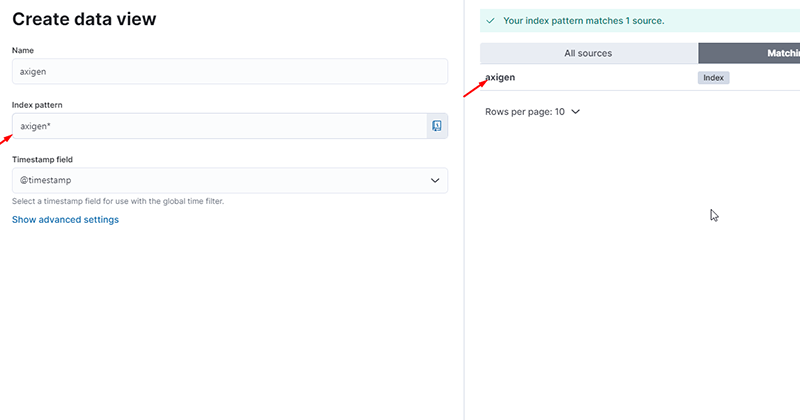
By default, there is no data view, so we have to create one.
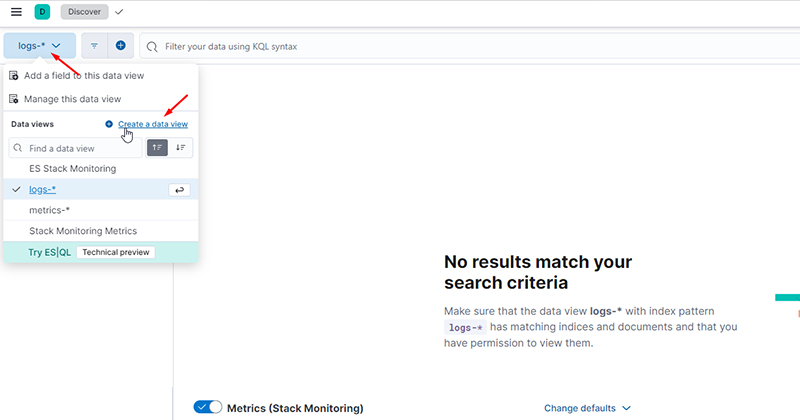
Note: In this example, Fluent Bit was already configured to send the logs from the Axigen server to Elasticsearch. If Axigen does not appear as a source, double-check that the logs are being properly sent to Elasticsearch, especially considering your Fluent Bit setup.
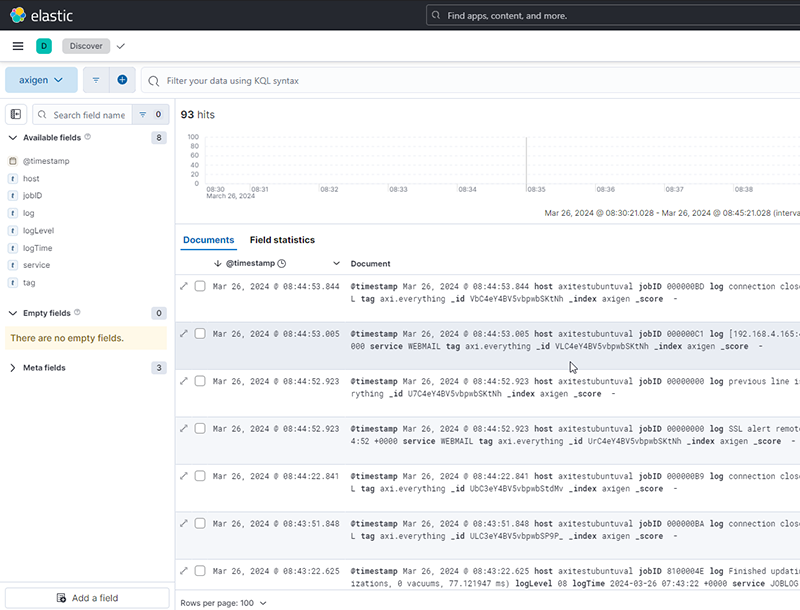
And there we go:
Conclusion
That's all there is to it! You've successfully linked Kibana with Elasticsearch, making your Axigen log data more approachable and manageable. This setup is not just about viewing logs; it's about efficiently extracting the insights you need.