Good metrics and reporting are vital in order to accurately monitor your Axigen email platform. That’s why, with X4, we’re bringing you modern performance tracking and application monitoring through Prometheus and Grafana.
The following short guide will lead you step by step through the wonderfully efficient & short task of setting up both services within an Axigen instance — demoed through Docker containers.
Let’s show you how to use Grafana and Prometheus to monitor Axigen.

Introducing: Axigen Support for Prometheus and Grafana
Performance metrics are one of the key points of application monitoring, providing crucial and decisive real-time data about how the system is behaving. These metrics can be further used to set up custom alerts in case the system unexpectedly malfunctions, or simply to provide meaningful historical and recent insights that can be used for performance tuning or analytics.
Starting with X4, Axigen features built-in support for Prometheus metrics, one of the leading open-source monitoring solutions. This feature allows you to effortlessly supervise any Axigen deployment, in only a few minutes!
Beyond Prometheus support, our X4 release can also be integrated with Grafana so you can benefit from proper data visualization.
Let’s first look at a basic Prometheus setup!
Setting Up Prometheus Reporting for Axigen
Step 1: Starting Up an Axigen Instance
For this tutorial, we will first require an Axigen instance. We can use Docker to quickly spin one up:
This command will start an Axigen container named axigen (--name=axigen) in the background (-d), with the admin password admin_pass (-e ADMIN_PASSWORD=admin_pass), while also mapping the container’s TCP port 80 to port 8080 on the local Docker host.
To get an interactive shell session in the newly created container in order to configure Axigen, simply execute:
Next, connect to Axigen’s administrative CLI and log in with the admin user and the password that we previously set (in our case, admin_pass):
Trying ::1...
Connected to localhost.
Escape character is '^]'.
Welcome to AXIGEN's Command Line Interface
You must login first. For a list of available commands, type HELP
<login> user admin
<password> admin_pass
For a list of available commands, type HELP
+OK: Authentication successful
<#>
Step 2: Preparing a Domain and User
In order to get relevant and real case scenario metrics, we will first create an example email domain. This requires the domain’s name, the path where it will store its files, and the postmaster account’s password. For this tutorial, we will create a domain.tld domain:
Although further extensive configuration is possible, it is not needed at the moment, so just issue a commit command to create the domain.
+OK: command successful
<domain-create#> commit
committing changes and switching hack to previous context.
This operation might take some time. Please wait...
+OK: command successful
<#>
We’ll also create a user named john.doe, with the john_pass password on the newly created domain:
+OK: command successful
<domain#> add account john.doe password john_pass
+OK: command successful
<domain-account#> commit
committing changes and switching hack to previous context.
This operation might take some time. Please wait...
+OK: command successful
<domain#> commit
committing changes and switching hack to previous context.
This operation might take some time. Please wait...
+OK: command successful
<#>
Step 3: Configuring the Axigen Server
Now we will configure the server, adding a WebMail listener on port 80 and starting the WebMail service, and also enable the reporting service for the domain, in order for Axigen to start generating metrics.
To configure the WebMail service, issue the following commands:
+OK: command successful
<server#> config webmail
+OK: command successful
<server-webmail#> add listener 0.0.0.0:80
+OK: command successful
<server-webmail-listener#> commit
committing changes and switching back to previous context.
+OK: command successful (listener is opened)
<server-webmail#> start service
+OK: command successful
<server-webmail#> commit
committing changes and switching back to previous context.
+OK: command successful
<server#>
… and, from the same server context, start the reporting service:
+OK: command successful
<server-report#> set domainEnable yes
+OK: command successful
<server-report#> start service
+OK: command successful
<server-report#> commit
committing changes and switching back to previous context.
+OK: command successful
<server#> commit
committing changes and switching back to previous context.
+OK: command successful
<#>
Step 4: Creating the Prometheus Admin User
Now that the reporting service is up and running, all that is left to do is create a user with permissions to access the reported metrics. Enter the aacl context and create a new admin-user named prometheus, set its password to prom_pass, and grant the user permission to access metrics:
* The changes made in the AACL context and its subcontexts
* are effective immediately (no DONE or COMMIT required)
+OK: command successful
<aacl#> add admin-user name prometheus password prom_pass
+OK: command successful
<aacl-adminUser#> grant permission (manageReporting)
+OK: command successful
<aacl-adminUser#> done
switching back to previous context.
+OK: command successful
<aacl#> done
switching back to previous context.
+OK: command successful
<#>
Finally, we’ll issue a save config command so all the changes are persistent, and exit the container.
+OK: command successful
<#> exit
WARNING: all changes made and not committed are lost
connection to AXIGEN closing.
+OK: have a nice day
Connection closed by foreign host.
root@57ab762203a1:/# exit
exit
[~/axigen] λ
That’s it! Our Axigen container will now export real-time metrics on the /metrics path, on port 9000 for HTTP and 9443 for HTTPS.
Step 5: Running Tests
To test this, let’s also start up a Prometheus that will scrape our Axigen instance. You can refer to the official Prometheus installation docs for doing so. In our case, we’ll again run a Docker container named prometheus in the background, mapping the default 9090 Prometheus port to the same one on the local host.
b262429715d8e7fe180297f4d656c040bb5e4d6c3532b3190f53dfad90d59454
[~/axigen] λ
To instruct Prometheus to target our Axigen container, we need to modify its configuration file. This can be done in a lot of ways, and you can read more about what Prometheus can and can’t do in their documentation.
For now, we’ll create a simple static configuration that will target our Axigen container IP address, which can be found with the following command:
172.17.0.2
[~/axigen] λ
Now that we have our desired IP address which we have to scrape, we need to modify the default Prometheus configuration file located at /etc/prometheus/prometheus.yml, which can be done with the following command:
You can use the following snippet to scrape the Axigen instance on HTTP. This will create a job named axigen, which targets our IP on port 9000 (targets: ['172.17.0.2:9000']), using basic authentication with the username and password combination we created earlier in Axigen.
- job_name: 'axigen'
basic_auth:
username: prometheus
password: prom_pass
static_configs:
- targets: ['172.17.0.2:9000']
Verify that the file is modified and saved:
scrape_configs:
- job_name: 'axigen'
basic_auth:
username: prometheus
password: prom_pass
static_configs:
- targets: ['172.17.0.2:9000']
[~/axigen] λ
… and send a SIGHUP signal to the Prometheus process (which, on Docker, will always have PID 1), in order for it to use the new configuration:
To check that Prometheus successfully scrapes our Axigen container, open http://127.0.0.1:9090/targets in your preferred browser, and check that our endpoint is correct and it has the “State” set to UP:

How to Integrate Grafana with Your Prometheus Instance
Although Prometheus supports visualizing the scraped metrics, it is somewhat limited in configuration to do so, since it is not its primary purpose. Grafana is a much better tool to do so, featuring rich and fully customizable dashboards and analytics.
Fortunately, it also has seamless Prometheus integration, along with many other data sources!
Step 1: Creating a Grafana Container
We’ll create a new Grafana container with:
2b2367d5820acf57335bdfd0da9cffe0c465f0a21598ec4b2f8479428912b9bc
[~/axigen] λ
… and access the portal on our browser at http://127.0.0.1:3000. We can log in with the default admin user and admin password:

We are then prompted to configure a new admin password for security purposes. You can select a new admin password, or skip this step for now by clicking on “Skip” below the “Submit” button:

Step 2: Configuring the Prometheus-Grafana Integration
After that, to add our Prometheus as a data source, we have to first know its IP address, which can be found just like we did before:
172.17.0.3
[~/axigen] λ
With this information in mind, we can now select Configuration → Data sources from the left side menu in the Grafana portal.
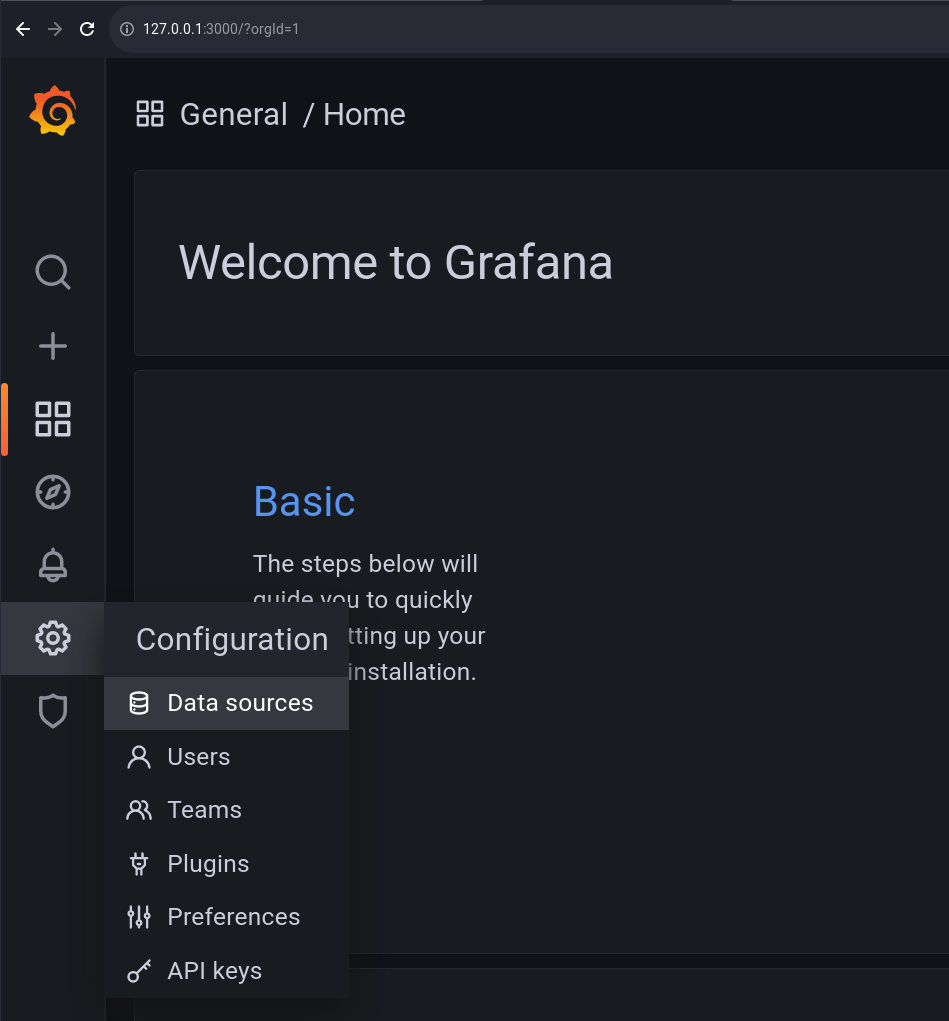
Click on Add data source, select Prometheus and input the URL of the instance, which is our Prometheus container’s IP address, with the HTTP protocol and port 9090:
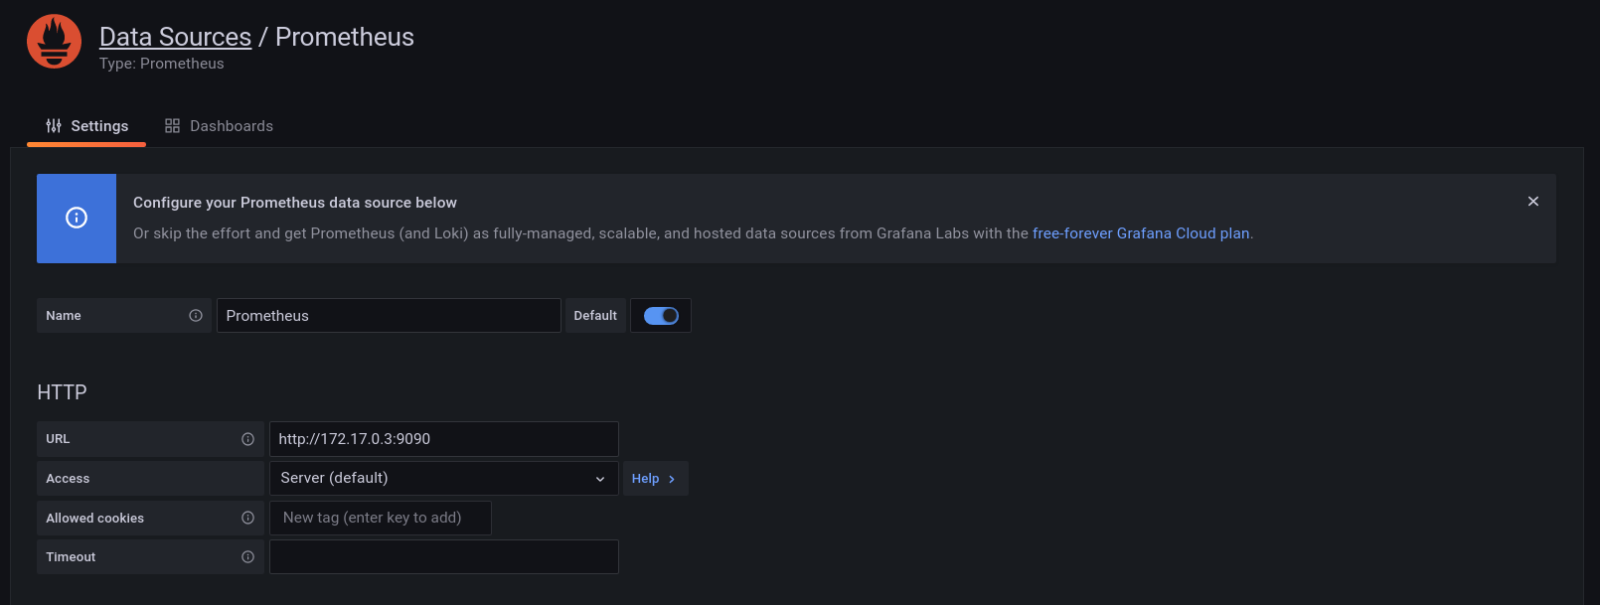
Save and verify that it’s working by clicking on the Save & test button located at the bottom of the page:

... and voilà! Axigen metrics collected by Prometheus can now be used to create beautiful dashboards in Grafana!
Steal Our Custom Grafana Dashboard!
Since Grafana queries and dashboards can be highly complex and sometimes involve a learning curve, we have created the following dashboard which you can import, in order to visualize just some of Axigen’s metrics:
Download the Axigen Grafana Sample Dashboard
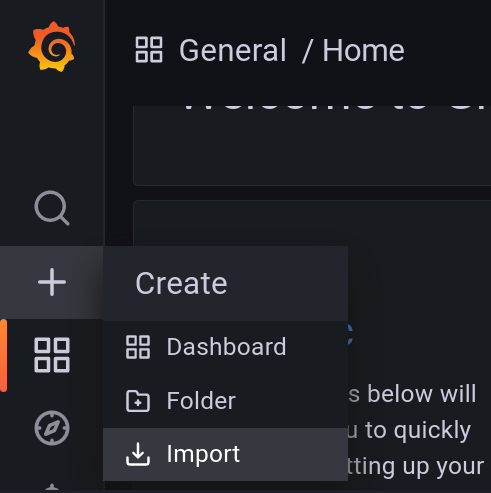
To import it, select Create → Import from the left side menu:
Then click on Upload JSON file, upload the file we have provided above, and finish by clicking on Import.
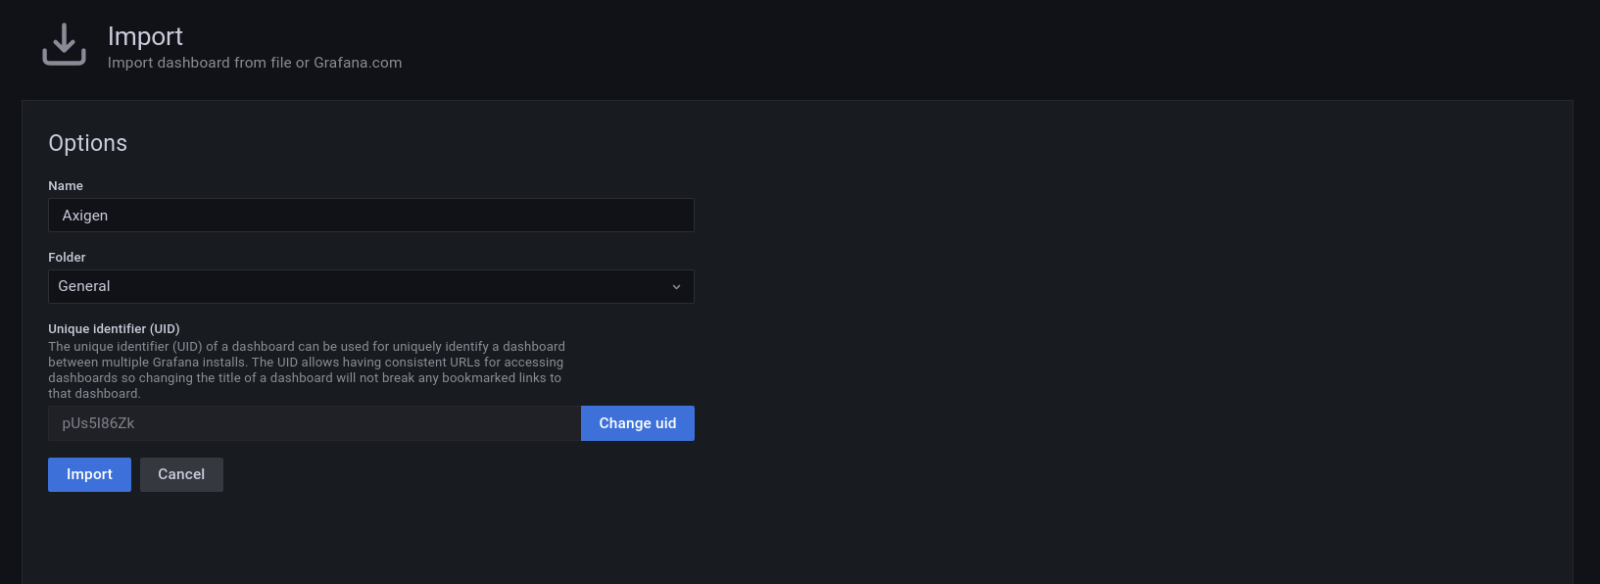
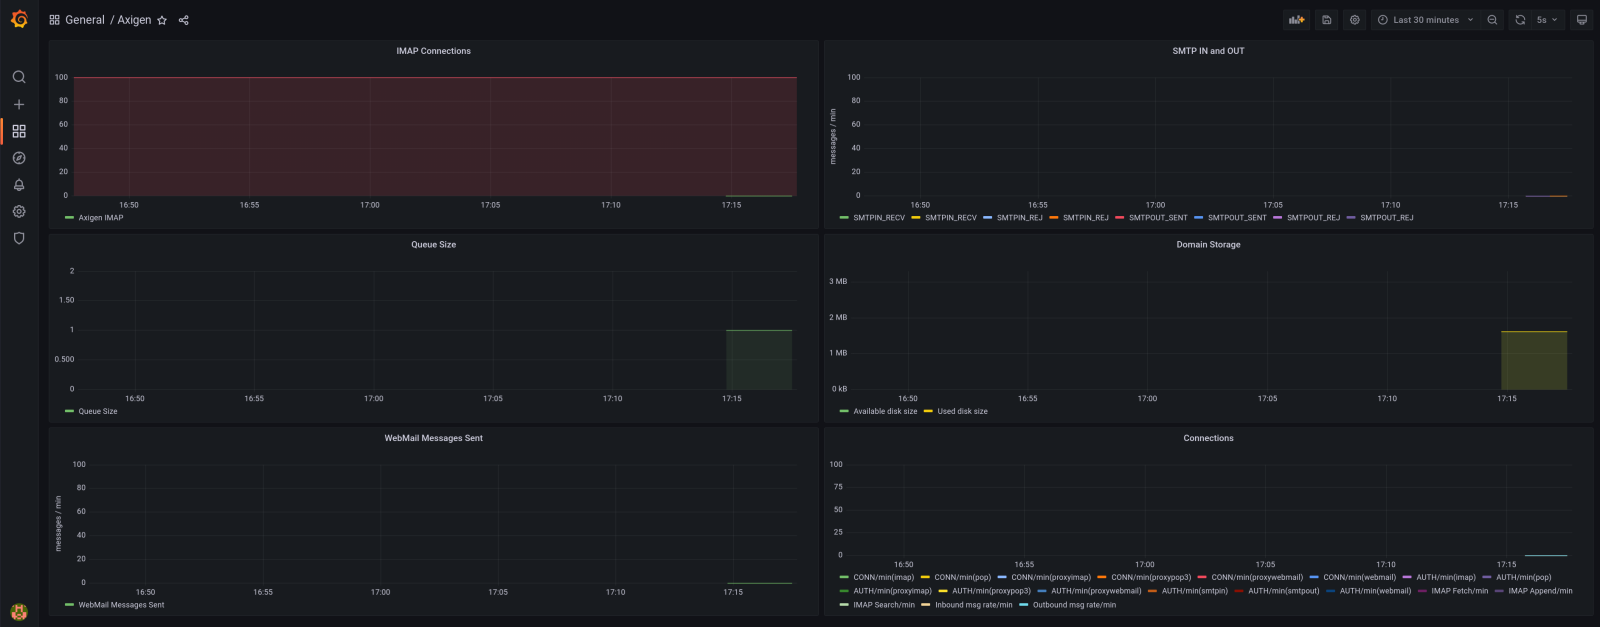
We should now be able to see a few dashboards with metrics exported by Axigen! However, since no interaction is made with it, these dashboards are quite static… let’s change that!
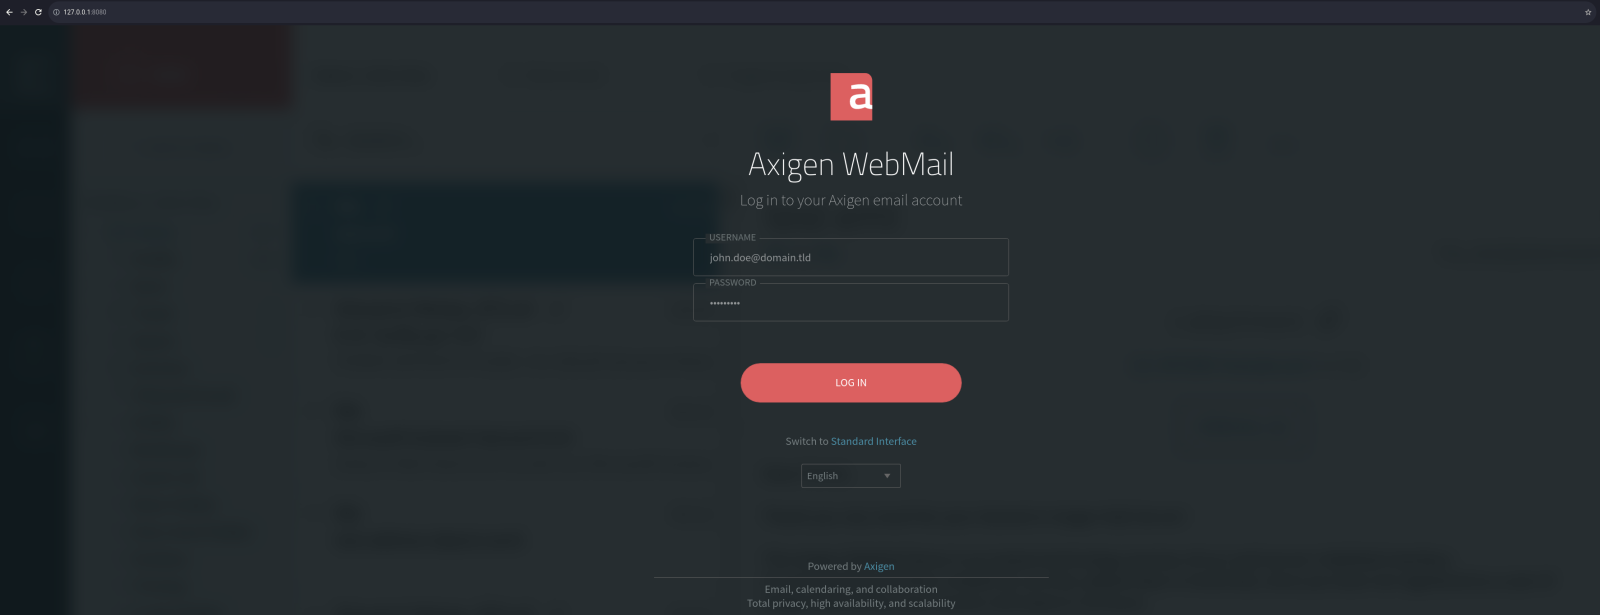
Visit http://127.0.0.1:8080 in order to access Axigen’s WebMail interface. To login, we’ll use our previously created account, john.doe@domain.tld with the john_pass password.
Log in and then click on the New button in the left corner to compose a new message. We’ll send one back to us since we only provisioned one account, so use john.doe@domain.tld for the To field and choose something inventive for the Subject and Body.
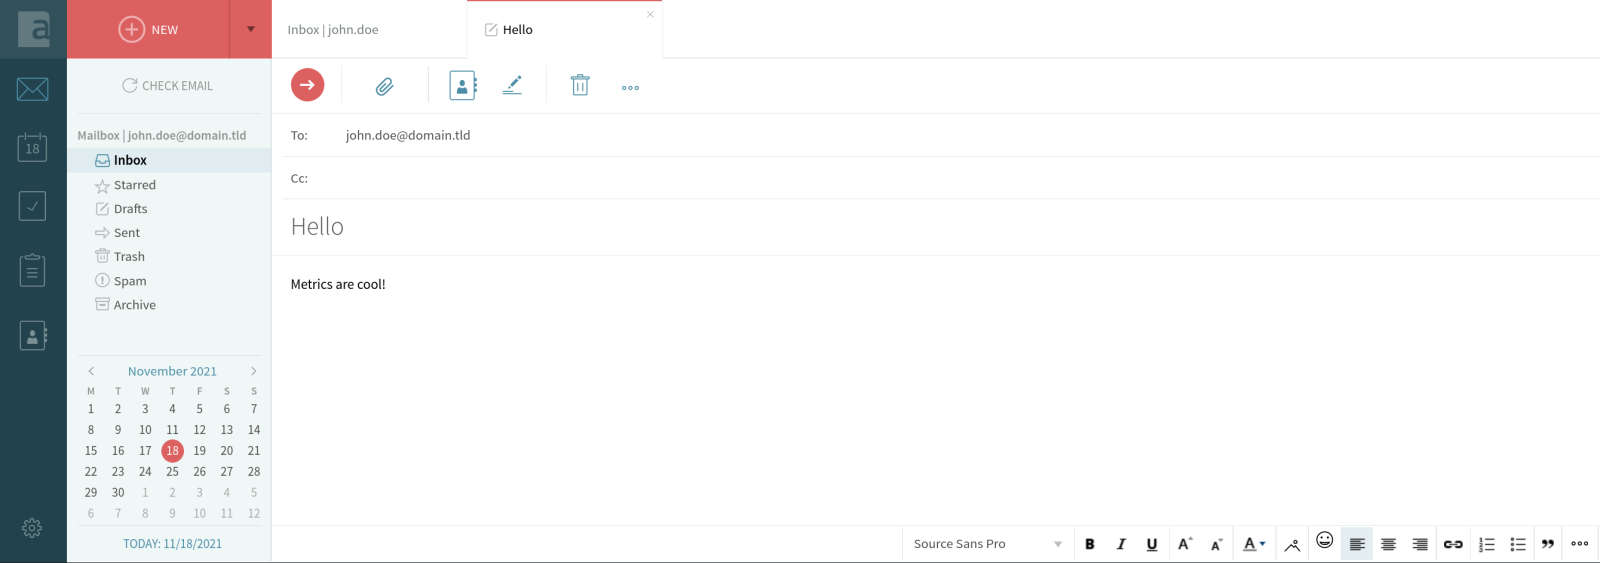
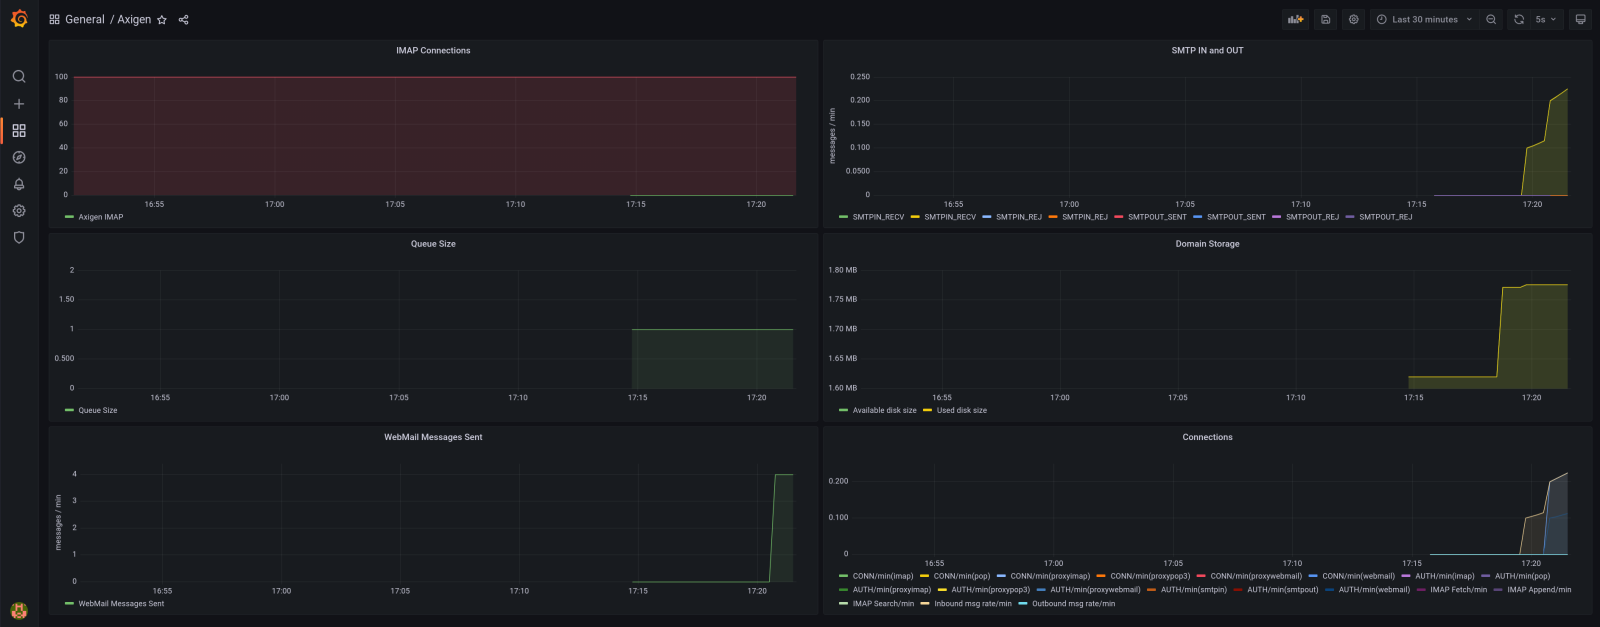
Once you are happy with it, you can use the big red arrow above the To field to send it. Now that we have generated some data, within a few seconds we should see some changes happening in the dashboards!
Quick and Efficient Monitoring and Reporting, Hassle-Free
Whether you’re fine with your current monitoring and reporting, or you decide to go with Prometheus, or to settle on the even-more-advanced metrics & dashboards in Grafana, you’ve now got the info you need.
You’ve learned what the difference between Grafana and Prometheus is, and how to set them both up in Axigen X4. Next stop? Quick and easy monitoring of your email platform. And if you’ve got any additional questions — please don’t hesitate to ask!