Now that the Reporting service is enabled, you can further navigate to the Status & Monitoring tab in WebAdmin and configure your first chart:
-
Click on the "Status & Monitoring" drop-down menu
-
Click on the "Charts" tab.
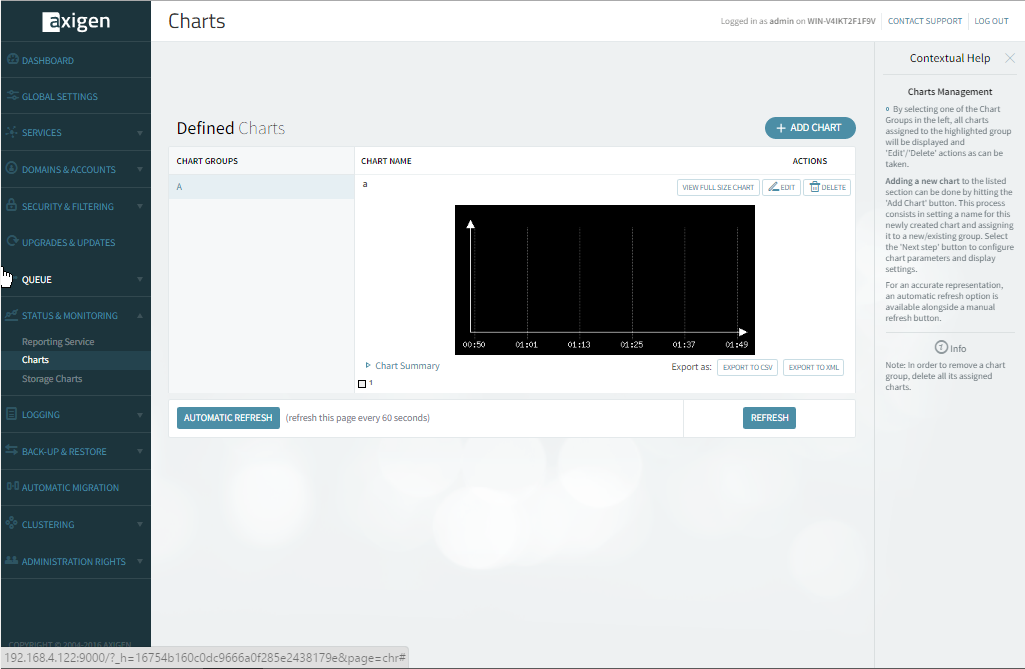
When first viewing the Charts page, a list of pre-configured charts and their corresponding groups will be displayed. These charts are automatically created by Axigen and record information based on common parameters that frequently interest server administrators, such as the system load average, the quantity of messages stored in the queue or number of HTTP user messages read, SMTP inbound messages, SMTP outbound total connections, IMAP total connections, POP3 total connections and much more.
Clicking on one of the Chart Groups on the left will result in displaying all the charts assigned to that specific group and enable you to edit or delete them. As a note, these pre-made charts may not meet every administrator's requirements right from the beginning, but they can be used as a starting point for creating additional ones, of great help for sys admins.