As previously explained, the Axigen Reporting service can be configured to monitor various parameters of interest. As a hands-on example, the following charts will detail the quantity of messages processed by the SpamAssassinBundled filter, depending on their status.
Example 1
Defining a chart that displays the quantity of messages passing the SpamAssassinBundled filter with the verdict of Spam:
-
Login to the WebAdmin interface;
-
Click on the "Status & Monitoring" drop-down menu;
-
Click the "Charts" link;
-
Click the "Add chart" button;
-
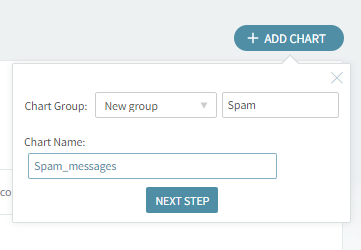
Type the name of the new chart group: "Spam", in this example;
-
In the "Chart Name" field, type the name of the chart to be created (in our case "Spam_messages");
-
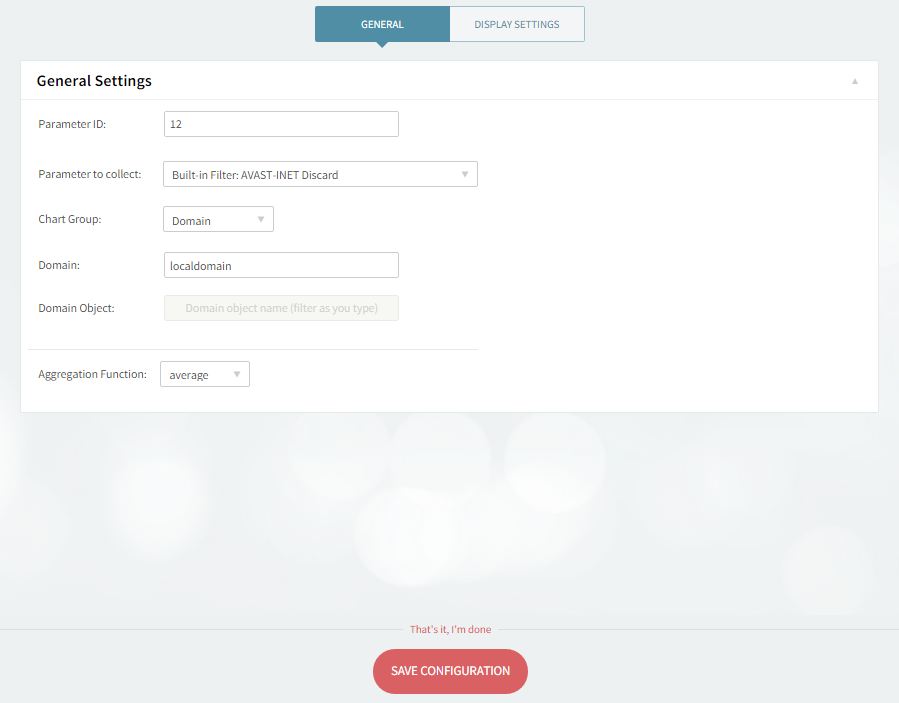
Within the "Parameters" section, click on the "Add chart counter", then select the Built-in Filter: SpamAssassinBundled Match parameter to collect.
-
Click the "Save configuration" button at the bottom to save the newly introduced data;
Please note that any changes to a chart's data recording settings will lead to a reset of the chart's information.
Example 2
Defining a chart that displays the quantity of messages passing the SpamAssassinBundled filter with the verdict of "Not Spam":
-
Click on the "Add Chart" button in the "Charts" page;
-
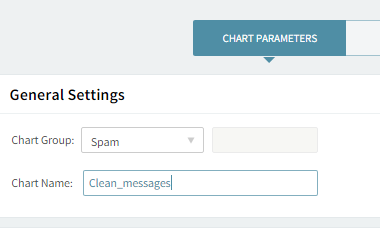
Click "Edit" on the already created Spam chart group;
-
In the "Chart Name" field, fill in the name of the chart to be created; in this case, you can type "Clean_messages";
-
Click on the "Next step" button. You will then access a new page with further configuration options regarding the chart parameters and display settings;
-
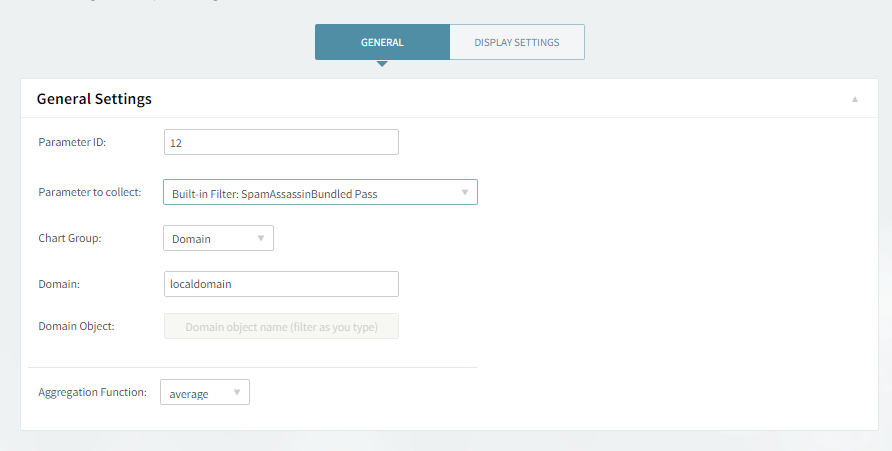
Within the "Parameters" section, click on the "Add chart counter", then select the SpamAssassinBundled "Passparameter" to collect.
-
Click the "Save configuration" button at the bottom to save the newly introduced data;
-
Click the "OK" button from the warning message box to complete the creation of the chart; since this is a new chart, there is no data stored regarding the specified parameter.
The above charts are mentioned as a guideline of the required steps to create and configure a chart.