Now we will focus on the different configurations we have mentioned above, especially on the ones determining how a chart looks like and how information is displayed in a chart.
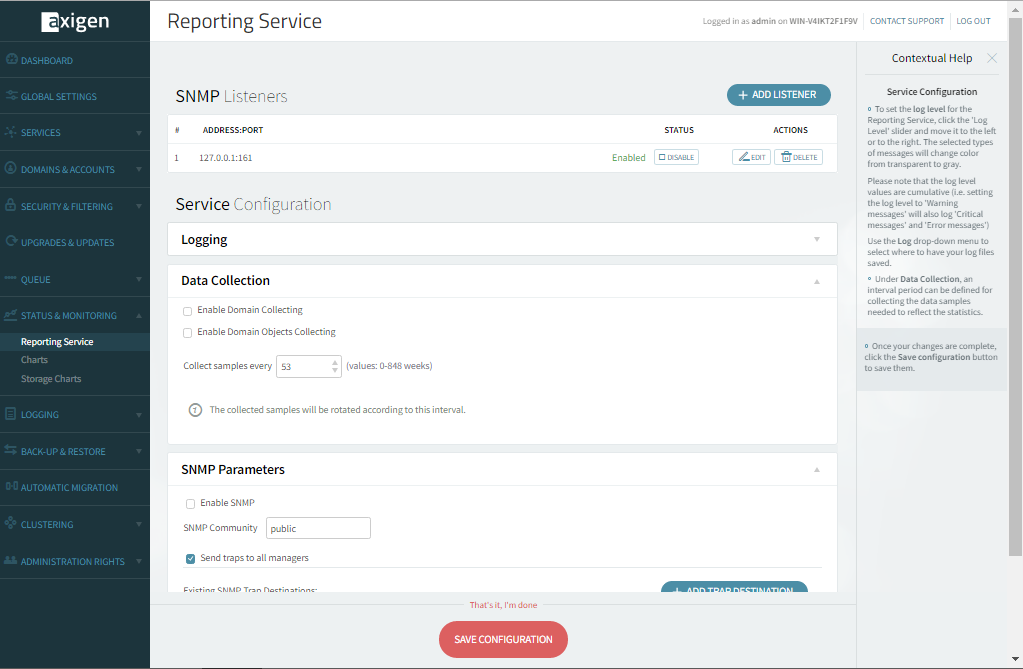
Data Collection Interval
Axigen uses a default setting of 60 seconds for polling information on the charts’ parameters. This means that once per minute (this being the smallest configurable interval of time) the Axigen Reporting service polls for data regarding all parameters that can be used for creating charts.
This configuration setting can be set to more than 60 seconds but, for performance reasons, it cannot be smaller than the 60 second default value. You can locate this configuration setting by following the next steps:
-
Log into the WebAdmin interface;
-
Click on the "Status & Monitoring" drop-down menu;
-
Click on the Reporting service tab;
-
The configuration option can be found under the "Data collection" section and it is expressed in seconds.
General Settings
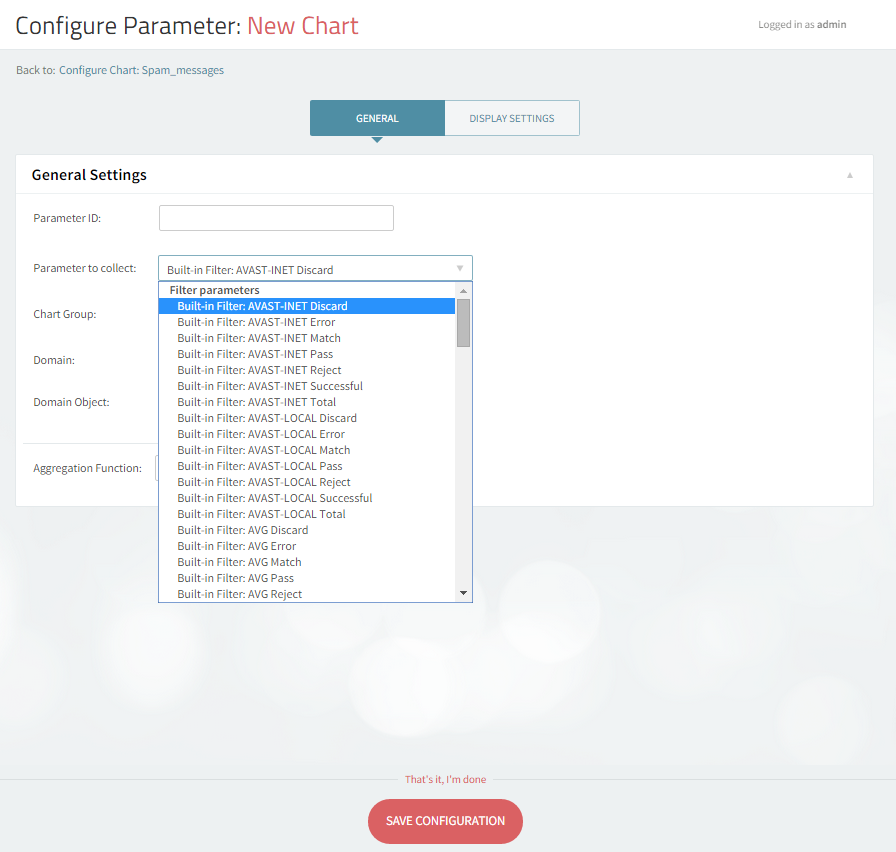
The "Aggregation Function" is applied to the values recorded in the sample interval from one aggregation interval to another. If the sample interval is equal to the aggregation interval, the "Average" aggregation function will not be applied.