In addition to the charts displayed in the WebAdmin interface, an SNMP service (Simple Network Management Protocol) is on hand. This service can be used as an agent that can be queried using the SNMP protocol. The SNMP agent is read-only for the Axigen configuration settings.
In order to find the parameters that can be monitored using the SNMP protocol, a MIB file can be downloaded by navigating to the following location:
-
Log into the WebAdmin interface;
-
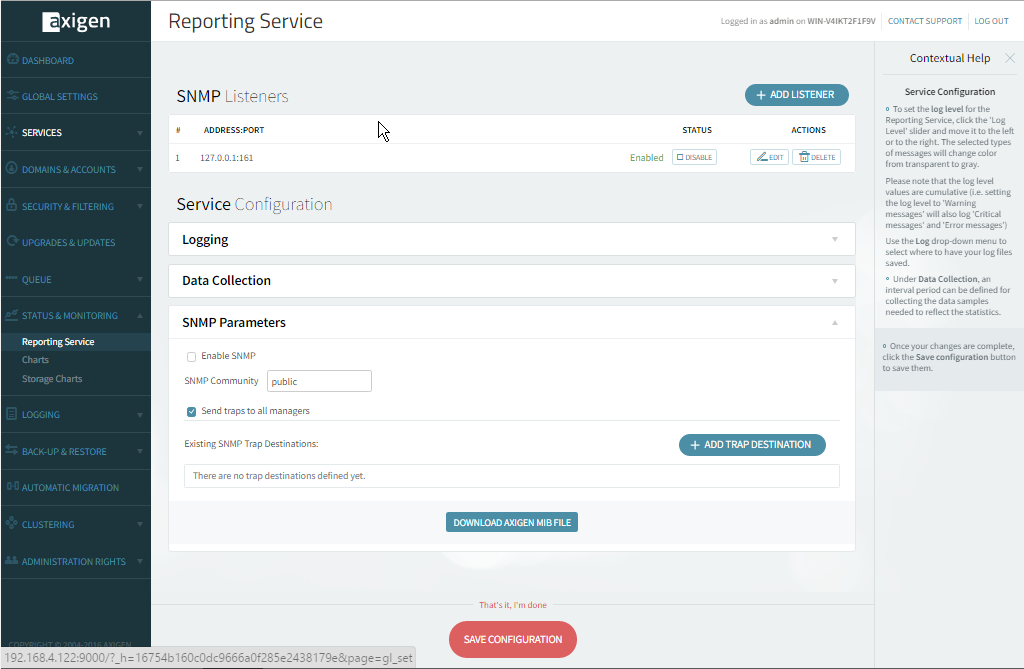
Click on "Status & Monitoring";
-
Click the Reporting service link;
-
Within the SNMP Parameters section, there is a link for downloading the mentioned file.
Generally, this type of file can be viewed using specialized tools that are able to interpret the format of the file and display it in a human readable form, most often as a tree. These tools are also called MIB browsers and they can be used as SNMP managers; meaning that they can query Axigen for information regarding its reporting parameters’ values. The MIB browsing tools can also be used to send and receive trap signals.
In practice, the tool for interpreting the MIB file is not necessarily required since MIB files are essentially text files that can be viewed using a text editor also.
The MIB file is used for associating a reference tag (also called OID), used to query AXIGEN for the value of the parameter, with the name of the parameter in a human readable way.
For example, the OID 1.3.6.1.4.1.29463.2.1 represents the reference tag for the Total mails placed in the queue parameter that returns a value which is interpreted as described below.
By querying the reporting parameters using the SNMP protocol, an odd behavior can be observed: the returned values are always increasing instead of reflecting the actual status of the reporting parameter being queried. The explanation is that the tools that retrieve information from Axigen using the SNMP protocol create charts based on the changes from the previous value of the parameter being queried, and not its actual value.
The SNMP reporting feature was designed with the purpose of creating performance representation charts, based on the information provided by the server, in a centralized solution where multiple other services are also monitored.
A typical example is a Network Operations Center where multiple machines and devices are monitored in a centralized way and all the information is consolidated using an SNMP managing tool that interprets trap signals when critical events occur or generates charts reflecting the usage of the managed devices.