The "Charts" → "Display Settings" page allows you to specify the parameters relative to a new or an already defined chart.
Predefined Styles

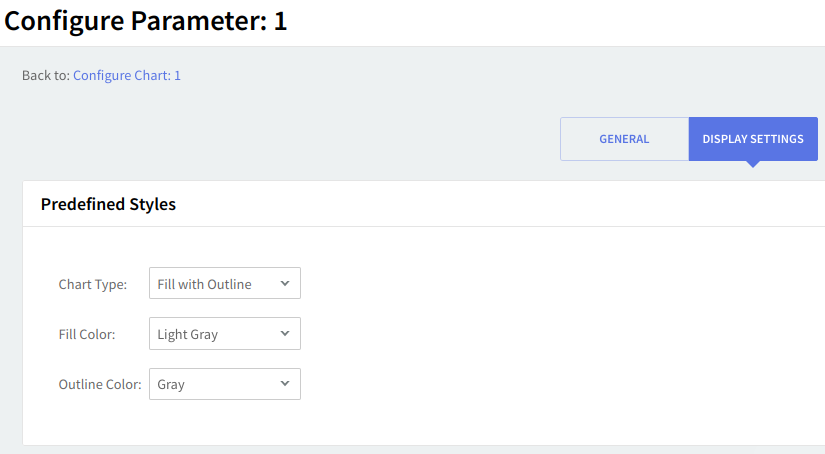
To choose one of the predefined graphic types use the "Chart Type" drop-down box. Available options are bars, discrete dots, discrete lines, fill, fill with outline, and outline types.
You can further customize the colors of your defined graphic using the "Fill color" and "Outline color" drop-down menus. Available options include black and white, grey, as well as red, orange, blue, magenta and green and their darker and lighter nuances.
Live Preview

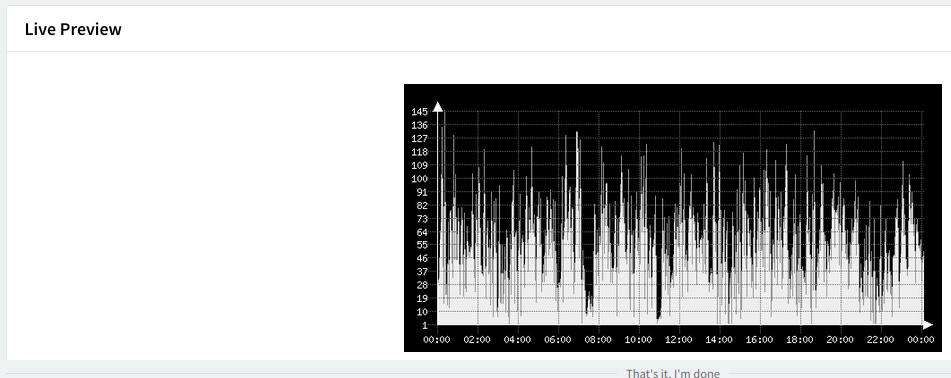
Preview the display of the selected chart type by checking the "Live Preview" section. In this case, for example, you can view the Discrete lines chart type.
When you are done configuring these parameters, remember to hit the "Save Configuration" button to preserve your changes.